Following feedback from our customers and their shareholders, we heartily agree that the best way for people to see the value of their shareholding is by… well, seeing it!
So we’re thrilled to release our new My Equity page.
Its detailed and dynamic features will help you fully understand your shareholding, visualise its potential value, and see what you could be taking home.
But before you start searching for that dream Aston Martin, here’s how your My Equity page works…
Understanding the graph and growth calculator
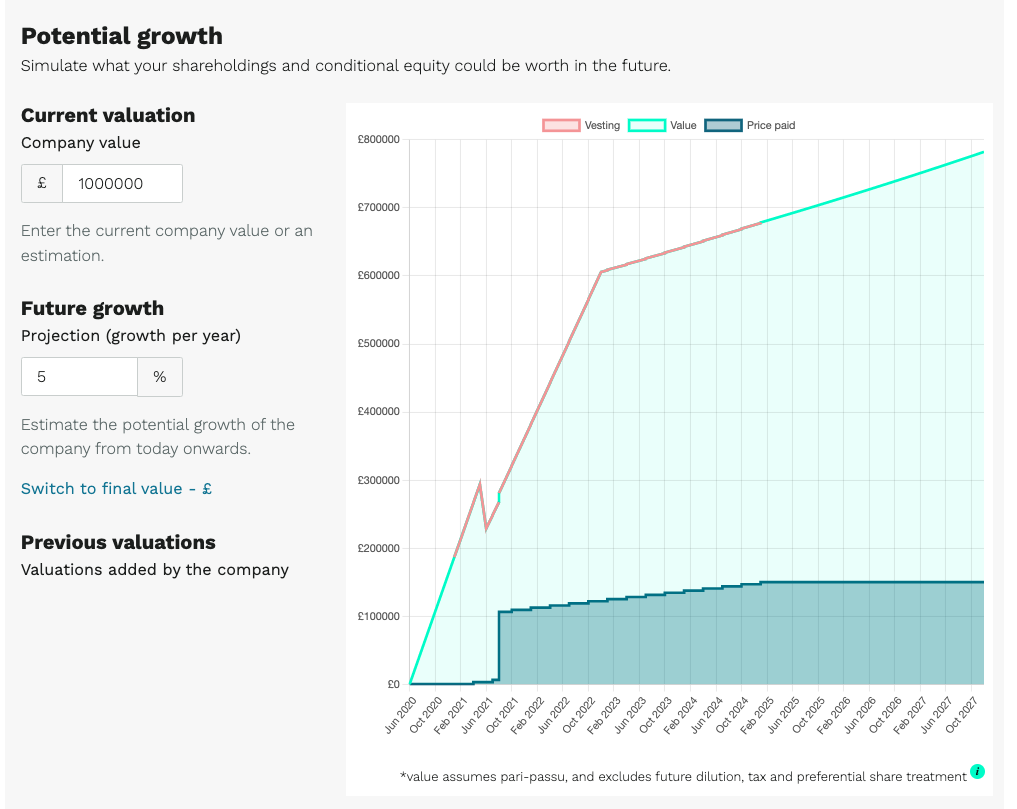
Our new dynamic growth calculator lets you simulate the growth of the company and see the potential value of your shares and options.
Enter the current or estimated company value and the potential future growth as a % growth per year or final company value to see how much your shareholding could be worth in the next 5 years.
The values you enter will be applied to the current month in the graph, and the growth from that point on simulates the potential value of your shareholding.
If you’ve received conditional equity (EMI, unapproved options, growth shares) you’ll notice the graph and figures below change when you switch between ‘Vesting over time,’ ‘Vested until now’ and ‘Simulate all vested.’ Here’s what each control means:
- Vesting over time shows your total shareholding and when it will vest as per your vesting schedule. The figures below represent its current value, with the potential value and profit based on the projections you set.
- Vested until now shows your current shareholding, not factoring in any unvested shares/options. The figures below represent its current cost, value and profit, and the potential value and profit won’t factor in any unvested shares/options either.
- Simulate all vested shows your total shareholding as if you had it today. As your total shareholding is brought forward to today’s date, its ‘current’ value and profit increase (rather than in incremental steps like in ‘Vesting over time’). The potential value and profit based on the projections you set will remain the same.

Your vesting schedule will be controlled by time-based vesting, performance milestones, or a combination of the two. You’ll be able to see the conditions attached to your shares and options in your agreement summary.
While this may sound obvious, it’s worth noting that the potential profit won’t be exact for a few reasons. One, you’re simulating future value and it’s not guaranteed.
But another not-so-obvious reason is that the value assumes that your class of shares has equal equity rights to all other classes of shares (this is what we mean by pari-passu). If other classes of shares have preferential rights, this may have a negative impact on your final values.
The graph also excludes any dilution through the exercise of options or future share issues, which would also reduce the final value.
And finally, we've included a dynamic tax calculator that uses the figures in the graph to calculate your net profit and tax liabilities. It also highlights how tax-advantageous your shares are compared to a cash bonus.
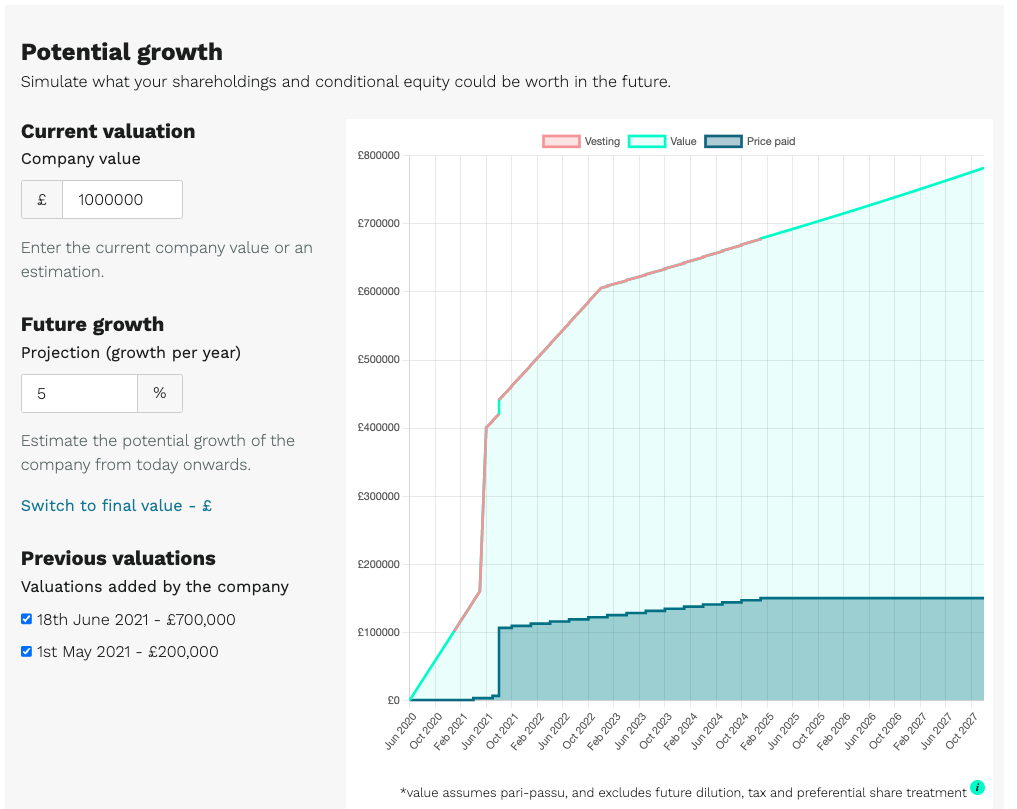
Previous valuations
‘Previous valuations’ are valuations that have been saved by the company on Vestd and are applied to your graph. They indicate the growth of your shareholding over time, and when you enter a projected value, it will continue from the most recent saved valuation.
You can toggle each valuation on and off to see how they impact your shareholding.
Horizontal lines are caused by two factors:
- Your shareholding didn’t increase during that period of time.
- A potential future value has been entered that’s the same as current value.
Vertical lines indicate an immediate increase or decrease in your shareholding from events such as share issues or sales, stock transfers and buybacks.
If your graph displays a sharp decrease in value, it’s likely due to a share issue from a recent investment round.
The reason for the decrease is that the share issuance creates more shares in the company which reduces your overall ownership – but in reality, an investment round increases the value of the company as funds are injected in.
The graph can only show data that's recorded on Vestd. So when shares are issued and pre- and post-investment valuations haven't been recorded, the graph recognises the reduction in overall ownership from the share issue and not the increase in the value of the company.
This misleading kink in your graph is easily fixed when the company adds a pre- and post-investment valuation to Vestd. Your graph will then display the changes and show an accurate value of your shareholding after the investment round.
This example shows a diluted view of the shareholder's shares after an investment round of £500,000 in June 2021. As the pre- and post-investment valuations haven't been added to Vestd, the graph can only show what has been added - the share issue from the investment round, which dilutes this shareholder's shares and decreases their value.
Now the company has added the pre- and post-investment valuation, the graph paints an accurate picture of how the £500,000 investment has increased the value of this individual's shareholding.
How are growth shares displayed?
If you’re a recipient of growth shares, your graph may show your shares as effectively worthless depending on the company valuation that’s entered.
This is because your growth shares are yet to surpass their hurdle rate – or in other words, the company value is yet to grow to the point at which your shares become valuable.
Once the company value exceeds your hurdle rate, you’re in the green and any amount above the hurdle is profit.
Learn more about your growth shares.
Portfolio view
If you have shares in more than one company on Vestd, you’ll also get a portfolio view of the aggregate value of each holding, based on the current modelling of each company.
The more of your shareholdings on Vestd, the more powerful your portfolio view will be.

How to invite shareholders to Vestd
All your shareholders will be recorded on the platform, but not all may have been invited to view their shareholdings.
The great news is that inviting more shareholders doesn’t impact your plan – so there’s no reason not to invite them all to visualise the value of their shareholding.
Go to Secretarial & admin > Company messaging to send an update to all your shareholders. Let them know about their new My Equity dashboard in the message (we’ve drafted something below) and they’ll receive an email with an invite link to join Vestd.
Our team, content and app can help you make informed decisions. However, any guidance and support should not be considered as 'legal, tax or financial advice.'