Welcome to your updated My Equity page — your personalised dashboard for tracking and understanding your equity. We’ve redesigned it to give you a clearer picture of what you own, what it’s worth today, and what it could be worth in the future.
Whether you're new to equity or just want a quick refresh, this guide walks you through each section so you can make the most of your dashboard.
- Summary Bar: Your Snapshot View
- Monetary Insights at a Glance
- Detailed Breakdown: Shares and Options
- Growth Shares
- Ordinary Shares
- Option Agreements - Equity Overview
- Option Vesting tab
- Overall Value tab - Future Value Estimations
- Company Valuation
🔹 Summary Bar: Your Snapshot View
At the top, you'll find your Summary Bar — your go-to for a quick glance at your equity.

Under My shares and My options you’ll find your number of issued shares and granted options displayed.

💡 Total figures for all your share issuances and option grants are visible in one place. So if you’ve been granted multiple awards, you’ll see a collective total number of all of your equity, only split by shares vs options!
💰 Monetary Insights at a Glance
The Summary Bar also shows key financial metrics:
- Current Value: The total worth of your equity (shares and options), based on your company’s latest valuation.
- Current Profit: The profit you'd make if you sold all vested shares and exercised options today, (including purchase costs but minus tax deductions).
- Projected Value: A forward-looking estimate of what your equity could be worth — based on the figure you enter further down the page in the ‘Estimated Profit in 5 Years’

🔍 Tip: Adjust the current company valuation to explore different scenarios and see your projected equity value update in real time (we'll show you how later).
🔽 Detailed Breakdown (Expand the Summary Bar)
Click the dropdown to see individual breakdowns of your:
📄 Share Issuances
Depending on the type of shares you've been issued, you'll see slightly different breakdowns:
🌱 Growth Shares
These are categorised into:
- Unconditional Shares: Fully owned by you — no strings attached.
- Conditional Shares: Ownership depends on meeting specific criteria, such as performance targets or deliverables.
- Deferred Shares: These carry no economic value or voting rights (you can also see the growth share issuance they were originally deferred from).
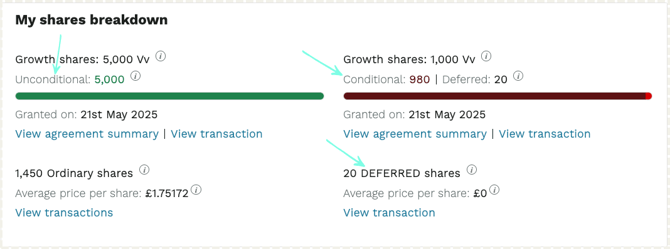
📈 Ordinary Shares
If you’ve been issued ordinary shares, you’ll also see:
- Share Class: Identifies the class of ordinary shares you've received (in the below example the share class is called ‘Ordinary’.
- Average Price per Share: The weighted average price paid per share at issuance.
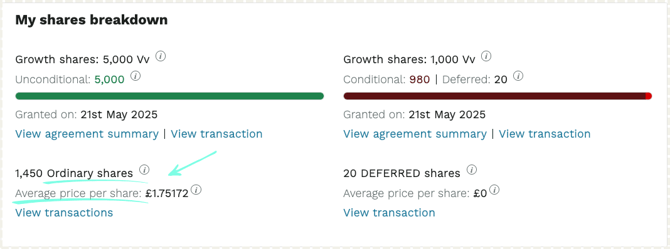
💡 Note: Payments for ordinary shares are handled outside of Vestd and must be completed before the shares are officially issued.
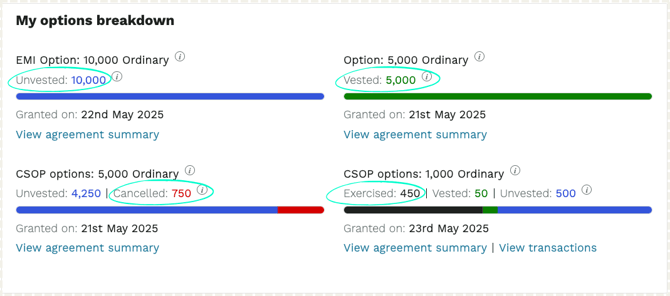
📄 Option Agreements
You’ll also see a breakdown of your option grants, including how they're categorised:
- Exercised: Options you’ve converted into shares after paying the exercise price — you now own these.
- Vested: These options are available to exercise (depending on your scheme).
- Unvested: These are still subject to your vesting schedule.
- Buyback: Options repurchased by the company — this figure shows how many have been bought back.
- Cancelled: Options that can no longer vest or be exercised (typically due to lapsing or unmet conditions).
📊 Equity Overview
Scroll down to see a visual summary of your equity holdings, with interactive charts and tabs depending on your equity type.
📁 Option Vesting tab
See how your equity has vested over time, split between:
- Vested options
- Unvested (yet to vest) options
- Exercised
- Cancelled

📈 Overall Value tab
Toggle the graph to explore your equity value from different perspectives:
- Vesting Over Time
See how your equity is expected to vest based on your agreement schedule, along with projected values over time.
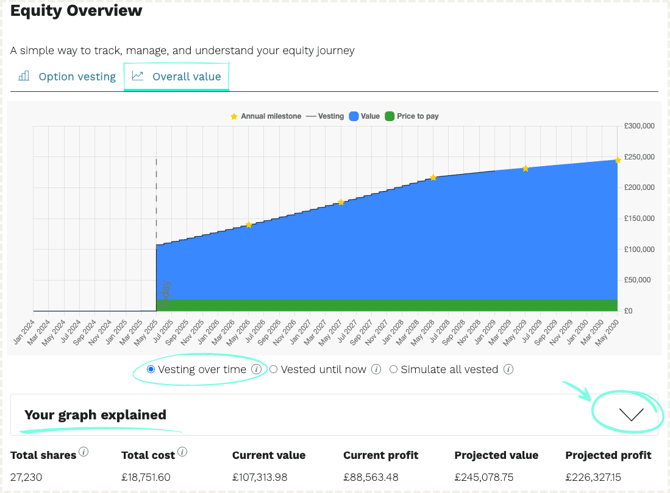
- Vested Until Now
View the equity that has already vested, including past and current projections based on what you’ve earned so far.

- Simulate All Vested
Explore the full potential value of your equity if everything were to vest today.

- The graph is also split into ‘value’ and ‘price to pay’ so you can see how much you can make but also how much you will need to pay to exercise your options
🔍 Tip: The figures below will update based on the simulation view you select.
🔮 Future Value Estimations
Want to forecast what your equity might be worth in 5 years?
Use the “Estimated profit in 5 years” bar to:
- Estimate your potential profit in 5 years.
- Input an annual growth percentage, a total company valuation, or a price per share to model your projections.
- Watch the graph update automatically to reflect your inputs.

📈 Try adjusting the numbers to see how your equity value could change based on different scenarios.
🏢 Company Valuation & History
Further down the page, you’ll see:
- The current company valuation, entered by the company that granted your equity.
- The ability to edit this figure to model projections.
- A list of historic valuations — untick these to see how they impact the projection graph.

That’s everything!
Your My Equity page now gives you clearer insights, quicker access, and more flexibility to understand and explore your ownership. 🎉